Falling within the same week for the past 3 years, the Super Bowl and Valentines Day both send shockwaves through the restaurant industry with unpredictable demand patterns. How does this affect restaurants?
We’ve broken down post-covid data from hundreds of restaurants across the US to fully understand the impact of these national celebrations.
Early February: A Rollercoaster for Restaurants
Early February is a time of high variability for restaurants.
Tough weather and stricter spending habits keep customers cautious, while on the other hand, events like Valentine’s Day, the Super Bowl, and NCAA tournaments lure consumers out of the warmth of their homes. In this frigid time of year, the two events, Valentine’s Day and the Super Bowl, stand out as particularly active days for consumers.
- On Valentine’s, between flowers, chocolates, a nice meal, and jewelry, spending exceeds $25 billion.
- Super Bowl Sunday reels in almost $18 billion, with food and beverages being the major expenditure.
So which day has a bigger impact? And more importantly—how can restaurants prepare?
We analyzed data from hundreds of restaurants across the US over the past 3 years to understand how these national celebrations disrupt the industry. The findings might surprise you.
The Limitations of Traditional Forecasting
Most restaurants rely on a moving average to predict customer traffic.
This means they look at recent sales trends to estimate future demand. On a normal day, this approach already has a 20% margin of error—but on event-driven days like the Super Bowl or Valentine’s Day, the deviation is even worse.
Take a look at this graph depicting deviation from the moving average for all restaurants monitored for this survey. (We’ll take a closer look at just the most impacted restaurants further in the article)

You’ll notice that the baseline deviation hovers around 17%, spikes up to 25% on Super Bowl Sunday, and gets as high as almost 40% on Valentine’s over the years.
This is where predictive forecasting changes everything. AI-driven tools can analyze external factors—like holidays, local events, and historical anomalies—to give restaurants a far more accurate picture of what’s ahead.
Who’s Most Affected?
Not every restaurant experiences these fluctuations equally. Our data reveals that, on average, 36% of restaurants were heavily impacted by the Super Bowl (with variance over 20%), compared to 40% by Valentine’s Day. These numbers indicate that a significant portion of establishments face substantial deviations from their expected performance during these events.

This may seem surprising—after all, QSRs aren’t the first place you think of for a romantic dinner. But with Valentine’s Day now encompassing everything from takeout date nights to Galentine’s gatherings, the impact is undeniable.
Visualizing the Impact
For the smaller subset of stores that felt the impact of these celebrations, the deviation from the moving average is much more palpable, with huge deviations from the norm. The highest deviation being Valentine’s Day 2024 with a 70% variance.
The graph below illustrates how the highly impacted stores deviated from the industry standard (moving average) on both holidays. The visual clearly shows that, despite common assumptions, QSRs are not immune to the effects of these national celebrations.

Valentine’s Day vs. The Super Bowl: A Closer Look
Despite the Super Bowl’s reputation as a takeout-heavy day, our data suggests Valentine’s Day actually has a larger overall impact on QSRs.
Why?
Total consumer spending: Over the past three years, Valentine’s Day spending has consistently outpaced Super Bowl-related food purchases.
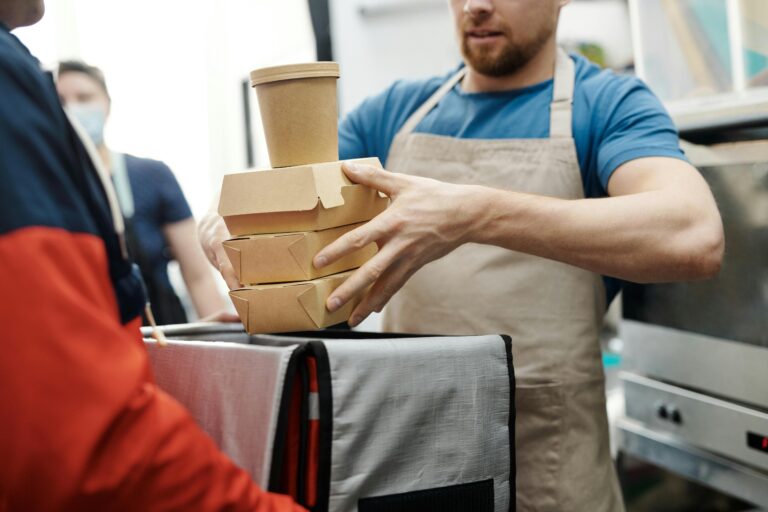
Diverse restaurant participation: Valentine’s Day affects a broader range of dining occasions—including casual and fast food options—compared to the Super Bowl, which primarily drives takeout and delivery.
For restaurants, this means predictive forecasting isn’t just helpful—it’s necessary.
Conclusion: The Case for Predictive Forecasting
With demand swings of 20%+ on even non-event-driven days, restaurants that rely solely on moving averages risk either under-preparing, leading to stockouts, long wait times, and lost revenue, or over-preparing, wasting inventory and inflating labor costs.
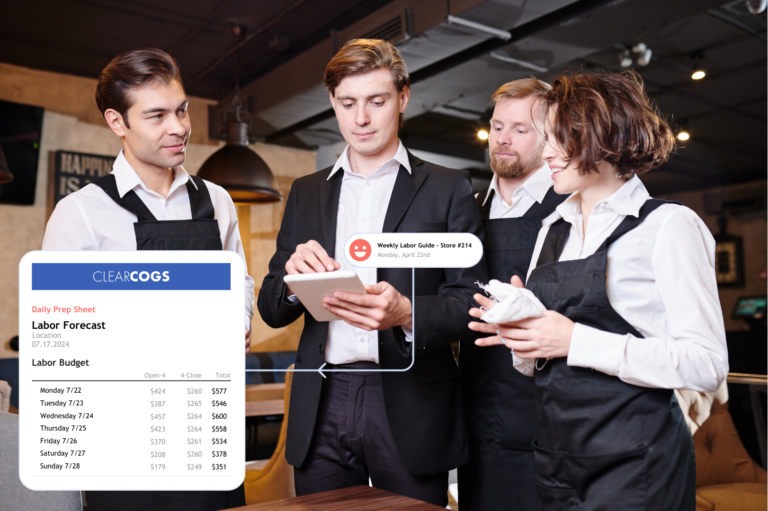
At ClearCOGS, our predictive forecasting tools leverage AI and advanced analytics to help restaurants anticipate spikes and slowdowns with precision. By integrating real-time external data into demand planning, we help restaurants stock, staff, and strategize smarter—even on the most unpredictable days.
Because in this industry, the difference between guessing and knowing is the difference between profit and loss.
How does your restaurant handle these high-variance days?