


(And What Seasonality, Sports, and Shifting Weekday Patterns Have to Do With It)
Anyone who’s worked in the restaurant industry knows one thing for sure: predictability is a luxury.
Rain, sunshine, local parades, or a playoff game can all swing demand in a matter of hours. And for operators trying to staff and stock accordingly, that unpredictability can be painful.
But underneath the chaos, there are patterns—seasonal rhythms that shape how and when customers dine out. Understanding these patterns isn’t just useful—it’s essential for smart forecasting and running a lean operation.
Let’s dive into one of the most interesting—and underappreciated—demand trends in restaurants: the evolving relationship between weekdays vs. weekends, how it changes across regions, and why March might just be one of the weirdest months of the year for restaurants.
The Weekday vs. Weekend Divide: It’s Not as Simple as You Think
There’s a universal truth in hospitality: weekends are busier. More people go out to eat. More revenue is made. And in many places, the weekend menu and vibe are a totally different experience.
But just how much busier are weekends?
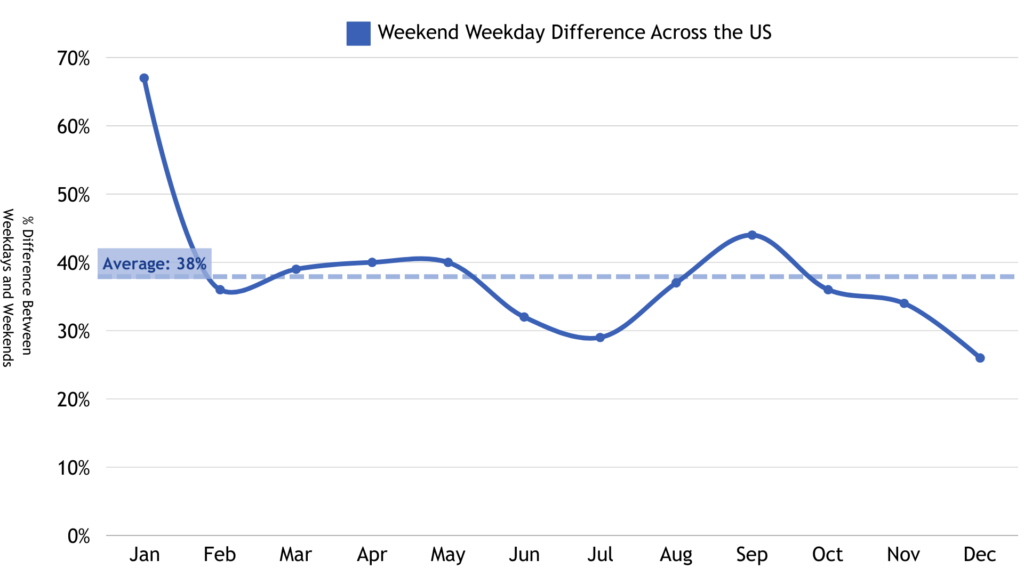
Across the U.S., restaurants on average see 38% more business on weekends compared to weekdays. That’s a big swing—and a big reason why staffing and prep levels need to shift accordingly.
But here’s where it gets interesting:
- In January, that difference spikes to 67% as diners save money or hibernate during the week.
- Then it drops dramatically in the summer and again around the holidays in November and December, as weekday dining picks up (think holiday shopping meals, family visits, etc.).
Location, Location, Location: Why Region Matters
It’s not just the calendar that matters—geography plays a massive role in how these trends show up.
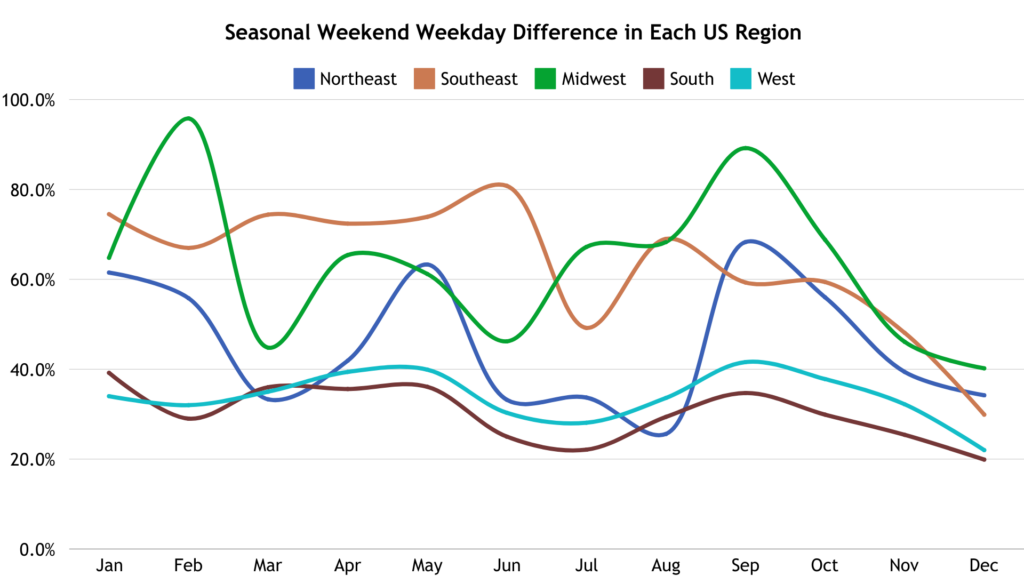
Let’s look at the average difference between weekday and weekend dining across regions:
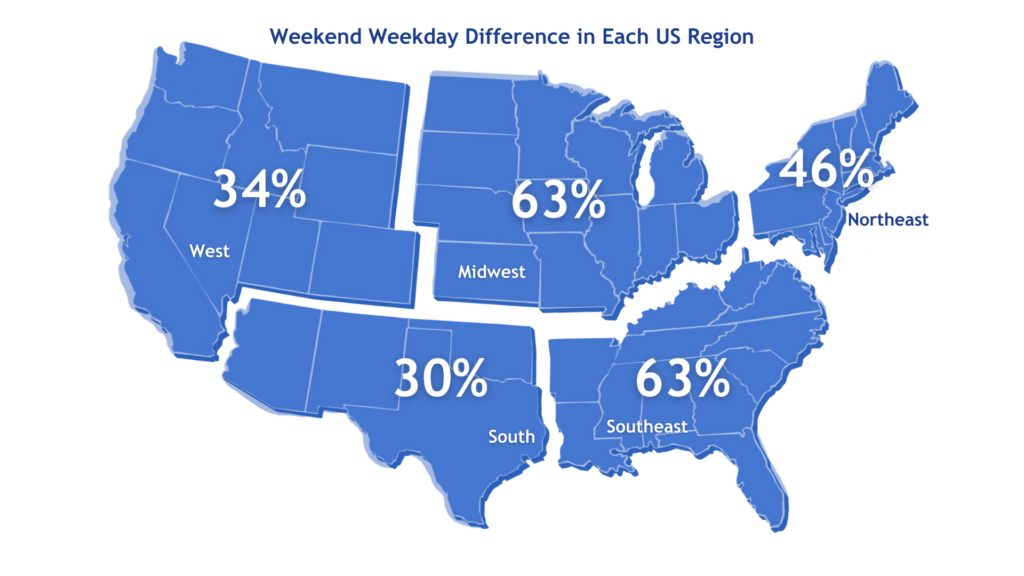
📍 Midwest & Southeast → 63% more traffic on weekends
📍 Northeast → 46% more traffic on weekends
📍 West & South → Just 30% more traffic on weekends
That means restaurants in the West and South see a more consistent flow of customers throughout the week, while those in the Midwest and Northeast rely heavily on weekend spikes.
Why the difference?
- Weather: Colder climates discourage casual weekday outings in the winter.
- Culture: In some regions, weekend dining is more ritualistic—family outings, church brunches, or Saturday date nights.
- Urban density: Places with high commuter or tourist traffic might see more balanced weekday volume.
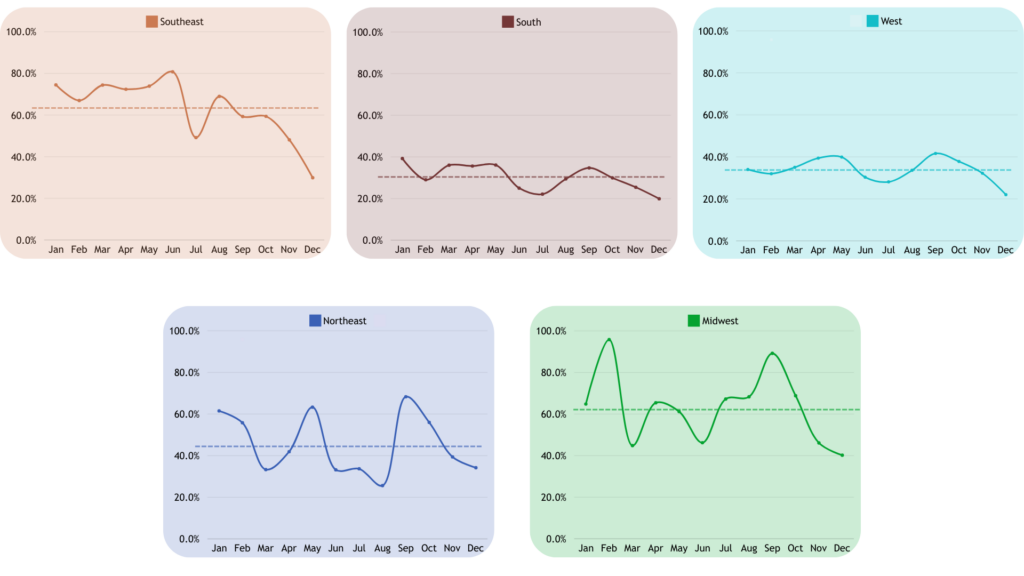
Even more fascinating: while southern and western regions maintain a fairly steady weekday-weekend gap year-round, the northeast and midwest experience sharp fluctuations depending on the season. The graphs below show how each regions sees these changes throughout the year:
What’s Up With March?
Here’s where things get even more unpredictable.
In many regions, March marks a turning point—but not in the way you’d expect.
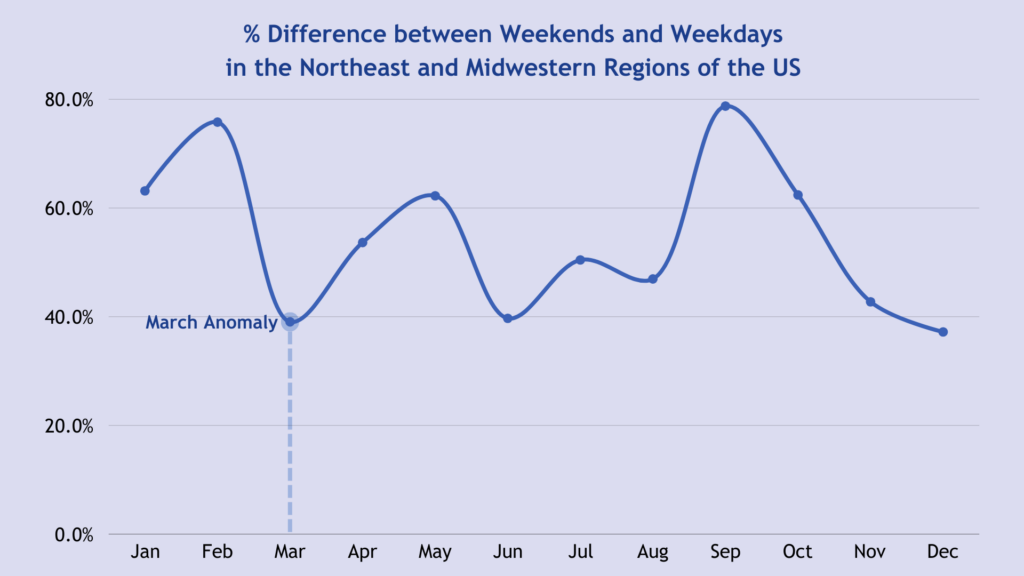
In the Northeast and Midwest, March brings a surprising drop in the weekday-weekend difference. That is, more people are going out on weekdays than usual—reducing the usual weekend surge.
Why? We had two theories:
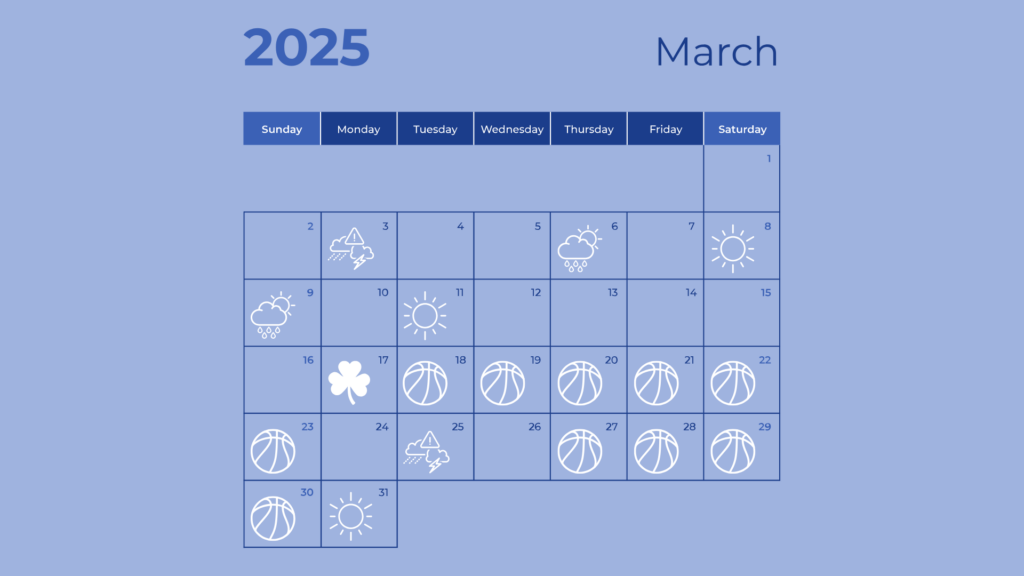
- March Madness. When the NCAA tournament kicks off in late March, bars and restaurants in sports-heavy regions see weekday traffic surge. People head out to watch their teams play—often during weekday lunch breaks or evenings. In states with top-ranked teams, the usual weekend-dominant patterns tend to flatten out.
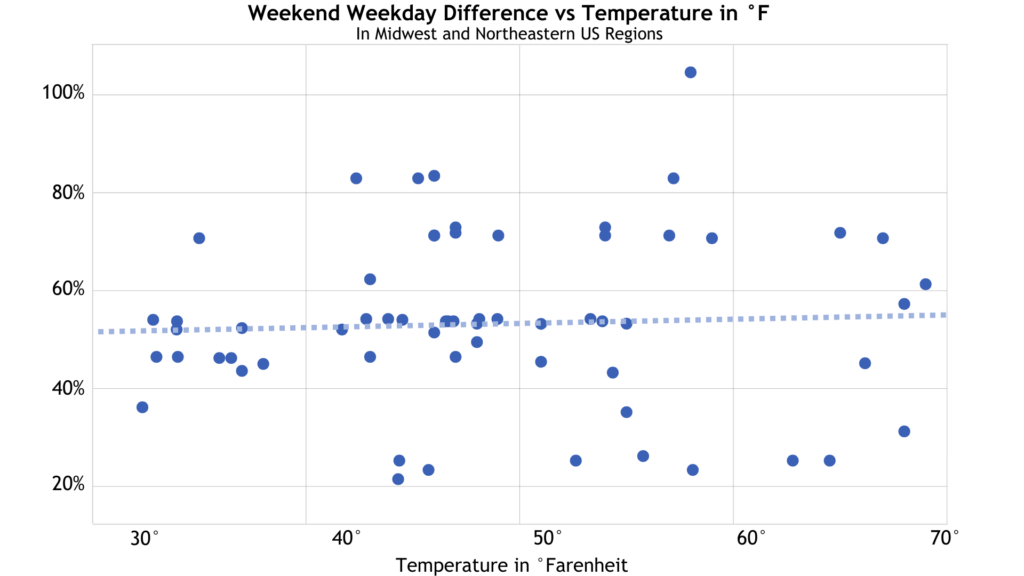
- Weather Whiplash. After months of bitter cold, we thought that even a few mild days could nudge people out of hibernation. However, when we plotted March temperatures against weekday weekend difference, we saw no correlation. What does this mean? Warm temperatures affect weekdays and weekends the same amount.
This March anomaly is temporary but intense. By April and May, the weekend/weekday split often returns—until the summer slump kicks in again.
What This Means for Restaurant Operators
If you’re still planning your labor and inventory based on a flat weekly forecast—or worse, gut feel—March will trip you up.
Understanding how seasonality, regional behavior, and even sports schedules influence demand can make the difference between:
Overstaffing and waste, or
Being caught unprepared during a surge
At ClearCOGS, we analyze exactly these kinds of patterns to help restaurants forecast demand down to the hour—factoring in everything from historical trends to temperature swings and national events.
Because when March hits, the only thing you can expect… is the unexpected.